Weather conditions in Pentraeth
Data collected using a Davis Vantage Vue weather station and Cumulus software. This page is usually updated every 10 minutes. All data back to November 2005, with readings every ten minutes, are archived on-line at Weather Underground. Click here for more information.
Go to: Graphs, 5 day forecast, Monthly summaries, Weather links.
Current conditions
Updated at UK time 20:10 on 24 April 2024
Forecast |
||||
| Mostly cloudy and cooler. Precipitation likely. Windy with possible wind shift to the W, NW, or N. | ||||
Temperature and Humidity |
||||
| Temperature | 8.0 °C | Dew Point | 2.9 °C | |
| Windchill | 8.0 °C | Humidity | 70% | |
Rainfall |
||||
| Rainfall Today | 0.0 mm | Rainfall Rate | 0.0 mm/hr | |
| Rainfall This Month | 50.0 mm | Rainfall This Year | 329.6 mm | |
| Rainfall Last Hour | 0.0 mm | Last rainfall | 2024-04-18 22:04 | |
Wind |
||||
| Wind Speed (gust) | 0.0 mph | Wind Speed (avg) | 0.0 mph | |
| Wind Bearing | 0° --- | Beaufort F0 | Calm | |
Pressure |
||||
| Barometer | 1014.33 mb | Falling | -0.52 mb/hr | |
Almanac |
||||
| Sunrise: | 05:57 | Moonrise: | 21:40 | |
| Sunset: | 20:34 | Moonset: | 05:48 | |
| Moon Phase: | Full moon |  |
||
Graphs and Past Data
These are now on separate pages:
Graphs of current and recent weather
Tables of past highs, lows & averages
Monthly Summaries

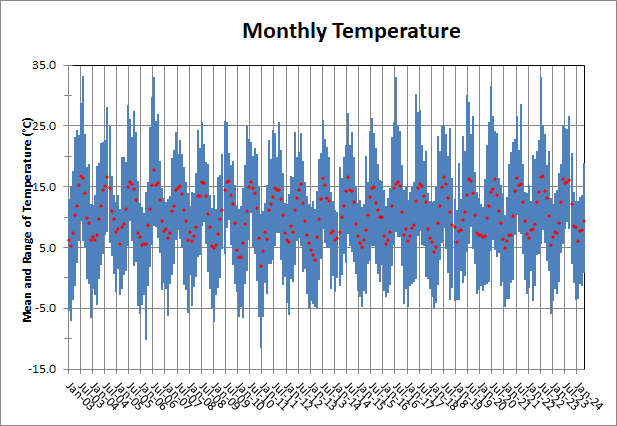
Monthly Mean Temperature (°C) |
||||||||||||
| Jan | Feb | Mar | Apr | May | Jun | July | Aug | Sep | Oct | Nov | Dec | |
| 2002 | 16.5 | 15.6 | 14.0 | 8.6 | 9.5 | 7.9 | ||||||
| 2003 | 6.2 | 5.2 | 7.3 | 10.3 | 11.9 | 15.2 | 16.7 | 16.5 | 13.9 | 9.8 | 9.0 | 6.2 |
| 2004 | 6.8 | 6.2 | 7.1 | 9.7 | 11.9 | 14.5 | 15.1 | 16.6 | 14.8 | 11.0 | 9.6 | 7.6 |
| 2005 | 8.0 | 5.6 | 8.4 | 8.9 | 11.3 | 14.9 | 15.8 | 15.5 | 14.6 | 12.8 | 7.3 | 6.7 |
| 2006 | 5.4 | 5.5 | 5.5 | 8.7 | 11.4 | 15.2 | 17.7 | 15.3 | 15.6 | 12.8 | 9.3 | 7.7 |
| 2007 | 8.1 | 6.5 | 7.4 | 11.0 | 11.9 | 14.5 | 14.8 | 15.1 | 13.8 | 11.2 | 9.4 | 6.2 |
| 2008 | 7.5 | 6.1 | 6.9 | 8.3 | 13.5 | 13.5 | 15.8 | 15.6 | 13.4 | 10.5 | 8.4 | 5.2 |
| 2009 | 4.9 | 5.4 | 7.2 | 9.6 | 11.1* | 14.5 | 15.7 | 15.9 | 13.7 | 12.1 | 9.1 | 4.5 |
| 2010 | 3.4 | 3.5 | 5.8 | 8.8 | 11.0 | 14.9 | 15.7 | 14.8 | 13.9 | 11.5 | 6.5 | 2.0 |
| 2011 | 4.4 | 7.5 | 6.4 | 11.1 | 12.2 | 13.3 | 14.7 | 14.5 | 14.5 | 12.9 | 10.3 | 7.3 |
| 2012 | 6.3 | 5.9 | 8.5 | 7.5 | 11.2 | 13.1 | 14.5 | 15.4 | 12.3 | 9.4 | 7.0 | 5.7 |
| 2013 | 4.6 | 3.8 | 3.0 | 6.7 | 9.7 | 12.9 | 16.4 | 15.2 | 13.1 | 12.6 | 7.3 | 7.7 |
| 2014 | 6.2 | 6.5 | 7.6 | 10.0 | 11.8 | 14.3 | 16.6 | 14.5 | 14.3 | 12.4 | 8.9 | 6.9 |
| 2015 | 5.7 | 5.0 | 6.3 | 7.9 | 10.3 | 13.3 | 14.7 | 14.9 | 12.3 | 11.2 | 10.0 | 10.0 |
| 2016 | 6.9 | 5.6 | 6.3 | 7.6 | 11.9 | 14.7 | 15.5 | 15.8 | 15.1 | 10.9 | 7.0 | 8.0 |
| 2017 | 6.1 | 6.9 | 8.2 | 8.7 | 12.7 | 14.7 | 15.4 | 15.1 | 13.4 | 12.5 | 8.0 | 6.6 |
| 2018 | 5.9 | 4.2 | 5.0 | 9.0 | 11.9 | 14.9 | 16.6 | 15.5 | 13.2 | 10.8 | 8.7 | 8.3 |
| 2019 | 5.9 | 7.7 | 7.8 | 9.5 | 10.9 | 13.7 | 16.2 | 16.0 | 13.9 | 10.4 | 7.3 | 7.1 |
| 2020 | 7.0 | 6.8 | 6.9 | 9.9 | 11.9 | 14.1 | 14.6 | 16.2 | 13.7 | 11.0 | 9.1 | 6.4 |
| 2021 | 4.9 | 6.1 | 7.1 | 7.1 | 10.1 | 14.3 | 16.5 | 15.3 | 15.4 | 12.4 | 9.4 | 7.2 |
| 2022 | 6.5 | 7.8 | 8.0 | 8.9 | 12.4 | 14.1 | 16.6 | 16.7 | 14.3 | 13.1 | 10.1 | 5.4 |
| 2023 | 6.8 | 7.5 | 7.3 | 9.0 | 12.5 | 16.2 | 15.6 | 15.8 | 16.1 | 12.1 | 8.6 | 8.3 |
| 2024 | 6.1 | 7.7 | 7.8 | |||||||||
* - Note that the actual mean for May 2009 may have been higher. The station was not collecting data for five days at the end of the month when the weather was warm.

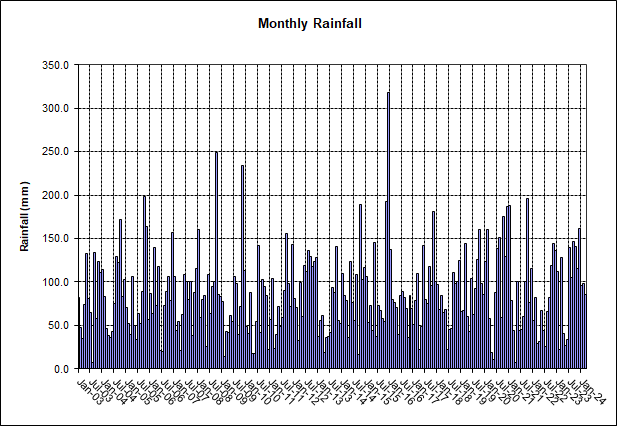
Monthly Rainfall (mm) |
|||||||||||||
| Jan | Feb | Mar | Apr | May | Jun | July | Aug | Sep | Oct | Nov | Dec | Total | |
| 2002 | 40.0 | 94.3 | 22.5 | 166.0 | 183.3 | 108.8 | |||||||
| 2003 | 82.3 | 47.3 | 35.3 | 73.8 | 133.3 | 81.5 | 65.3 | 7.0 | 134.0 | 57.8 | 123.3 | 111.3 | 952.2 |
| 2004 | 114.5 | 83.8 | 46.5 | 38.8 | 36.5 | 42.5 | 75.5 | 129.5 | 122.8 | 171.8 | 82.8 | 102.5 | 1047.5 |
| 2005 | 70.8 | 52.8 | 40.0 | 106.5 | 49.8 | 33.5 | 64.3 | 51.8 | 89.3 | 198.0 | 163.8 | 56.78 | 977.4 |
| 2006 | 86.3 | 63.5 | 139.5 | 73.5 | 117.5 | 21.5 | 20.3 | 73.5 | 89.5 | 106.8 | 78.8 | 156.4 | 1027.1 |
| 2007 | 106.4 | 44.6 | 54.9 | 21.1 | 63.0 | 108.3 | 100.9 | 79.7 | 100.1 | 37.9 | 88.0 | 115.3 | 920.2 |
| 2008 | 160.0 | 58.6 | 79.9 | 84.9 | 25.2 | 108.4 | 64.0 | 95.2 | 100.8 | 248.9 | 85.2 | 82.9 | 1194.0 |
| 2009 | 77.4 | 13.9 | 43.1 | 42.1 | 61.7 | 55.0 | 106.8 | 98.0 | 39.9 | 72.3 | 234.7 | 113.8 | 958.7 |
| 2010 | 48.9 | 40.2 | 88.3 | 17.6 | 17.3 | 54.7 | 142.1 | 41.7 | 102.9 | 94.4 | 84.2 | 22.0 | 754.3 |
| 2011 | 56.7 | 103.8 | 22.9 | 39.0 | 71.4 | 48.3 | 59.6 | 90.1 | 155.3 | 98.3 | 72.1 | 142.7 | 960.2 |
| 2012 | 80.5 | 70.1 | 33.2 | 99.2 | 60.4 | 119.3 | 111.9 | 135.8 | 128.8 | 118.2 | 124.0 | 128.6 | 1210.0 |
| 2013 | 37.6 | 56.2 | 62.0 | 19.2 | 36.4 | 37.2 | 41.4 | 94.0 | 88.4 | 141.2 | 55.4 | 51.8 | 720.8 |
| 2014 | 110.0 | 84.8 | 78.4 | 35.8 | 123.6 | 76.8 | 55.4 | 108.2 | 16.6 | 189.4 | 102.6 | 116.8 | 1098.4 |
| 2015 | 106.0 | 53.2 | 72.4 | 44.2 | 145.8 | 37.6 | 73.4 | 66.8 | 57.8 | 54.6 | 193.0 | 318.0 | 1222.8 |
| 2016 | 137.2 | 79.8 | 76.6 | 71.2 | 39.0 | 84.8 | 89.4 | 82.0 | 69.8 | 36.0 | 84.8 | 69.8 | 920.4 |
| 2017 | 51.4 | 78.8 | 110.2 | 22.4 | 48.2 | 142.0 | 79.8 | 75.6 | 118.2 | 95.4 | 180.8 | 100.0 | 1102.8 |
| 2018 | 96.8 | 67.8 | 84.6 | 64.6 | 68.2 | 22.0 | 45.8 | 46.0 | 111.0 | 98.0 | 100.8 | 124.2 | 929.8 |
| 2019 | 66.2 | 67.6 | 144.0 | 59.8 | 42.6 | 104.0 | 62.8 | 93.0 | 125.4 | 160.6 | 98.0 | 85.2 | 1109.2 |
| 2020 | 123.4 | 160.6 | 57.8 | 18.4 | 11.0 | 88.4 | 139.0 | 151.2 | 59.6 | 175.6 | 129.8 | 187.4 | 1302.2 |
| 2021 | 188.2 | 78.8 | 43.8 | 7.6 | 100.4 | 43.6 | 45.4 | 60.2 | 100.6 | 196.6 | 76.0 | 115.8 | 1057.0 |
| 2022 | 55.8 | 82.2 | 29.6 | 31.2 | 67.2 | 43.8 | 25.2 | 66.2 | 81.8 | 119.0 | 144.2 | 136.8 | 883.0 |
| 2023 | 111.8 | 21.8 | 127.8 | 41.0 | 27.0 | 33.6 | 139.4 | 105.2 | 146.6 | 140.4 | 116.0 | 161.6 | 1172.2 |
| 2024 | 96.0 | 98.4 | 85.2 | ||||||||||
Seasonal Total Rainfall (mm) |
||||
| Winter | Spring | Summer | Autumn | |
| 2002 | 134.3 | 371.8 | ||
| 2003 | 238.3 | 242.3 | 153.8 | 315.0 |
| 2004 | 309.5 | 121.8 | 247.5 | 377.3 |
| 2005 | 226.0 | 196.3 | 149.5 | 451.0 |
| 2006 | 206.5 | 330.5 | 115.3 | 275.0 |
| 2007 | 307.4 | 139.0 | 288.9 | 226.0 |
| 2008 | 333.9 | 190.0 | 267.7 | 434.9 |
| 2009 | 174.2 | 146.9 | 259.8 | 346.9 |
| 2010 | 202.9 | 123.2 | 238.5 | 281.6 |
| 2011 | 182.5 | 133.3 | 197.9 | 325.7 |
| 2012 | 293.4 | 192.7 | 367.0 | 371.0 |
| 2013 | 222.4 | 117.6 | 172.6 | 285.0 |
| 2014 | 246.6 | 237.8 | 240.4 | 308.6 |
| 2015 | 276.0 | 262.4 | 177.8 | 305.4 |
| 2016 | 535.0 | 186.8 | 256.2 | 190.6 |
| 2017 | 200.0 | 180.8 | 297.4 | 394.4 |
| 2018 | 264.6 | 217.4 | 113.8 | 309.8 |
| 2019 | 258.0 | 246.4 | 259.8 | 384.0 |
| 2020 | 369.2 | 87.2 | 378.6 | 365.0 |
| 2021 | 454.4 | 151.8 | 149.2 | 373.2 |
| 2022 | 253.8 | 128.0 | 135.2 | 345.0 |
| 2023 | 270.4 | 195.8 | 278.2 | 403.0 |
| 2024 | 356.0 | |||
Affiliations

Other weather links
BBC - Recent conditions and five day forecast for Pentraeth
Llansadwrn - Extensive weather pages for a nearby village.
Valley weather data (Met Office) - Weather data for last 24 hours from Valley, Anglesey
Holyhead Port - Weather station at the port.
Hint.FM wind map - Fascinating animated map of winds over the USA, done by artists Fernanda Viégas and Martin Wattenberg, who work for Google.
Snowdon Live - Weather on top of Snowdon, the highest mountain in Wales & England.

